News describes information or a claim. A chart records how market participants have traded around known and unknown information. Price can move before, during, or after a headline reaches you.
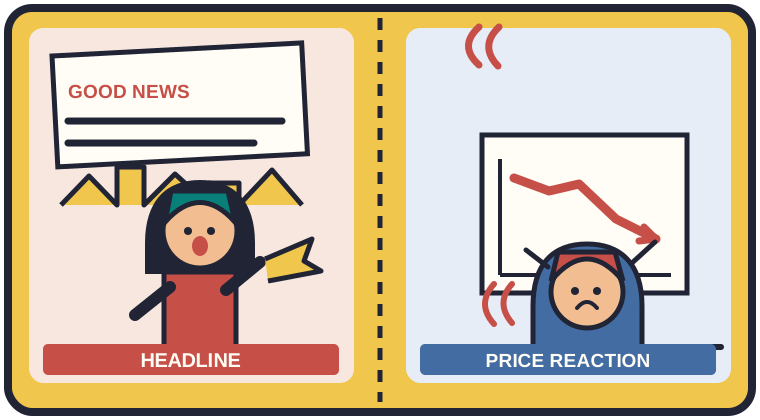
Why “which comes first?” has no fixed answer
A chart is not separate from news. It is a record of orders being matched: people and systems may be reacting to company announcements, rumours, economic data, positioning, liquidity, or technical levels at the same time. A price move may begin while expectations are changing, before a formal result is published, or after a widely discussed event when traders decide the actual outcome is less impressive than they hoped.
There are at least three clocks to keep in mind:
- The information clock: when a fact, rumour, result, or guidance update becomes available to a particular person. Not everyone receives or interprets it at the same moment.
- The expectation clock: what market participants already anticipated. A result can be good in isolation but disappointing relative to the expectations reflected in the price.
- The trading clock: when orders, liquidity, and positioning turn those interpretations into prices. A chart shows this process, but it does not identify every cause.
That is why the public headline and the chart can appear to disagree. They may be answering different questions: “Was the business result positive?” versus “Was it better than what buyers had already priced in?”
Positive news does not guarantee a rising price
Suppose fictional Company ABC reports revenue growth of 12%. The headline looks positive. But investors had expected 20%; operating margins fell, management lowered next-quarter guidance, and the share had risen 25% in anticipation. A decline after the announcement does not automatically mean the market is irrational. Participants may be repricing future expectations, not grading the headline as simply good or bad.
The reverse can happen too. A company can report a loss, yet the share rises if the loss is smaller than feared, cash burn slows, or guidance is less negative than expected. This does not make the business healthy; it describes a change in expectations at that moment.
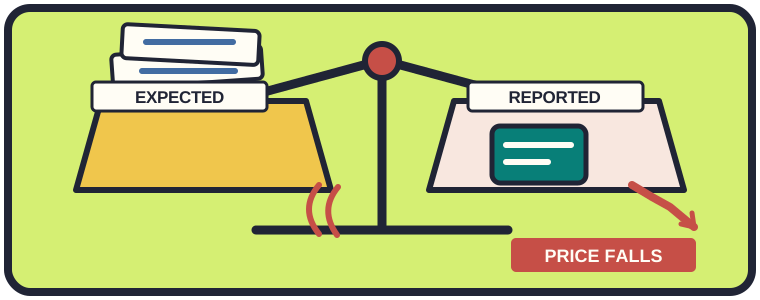
Three fictional situations, three different questions
ABC beats last year’s revenue but misses analyst expectations and trims its outlook. Ask what changed in future earnings, margins, cash flow, or risk. Do not buy solely because the candle looks oversold; do not sell solely because one session is red.
ABC announces a weak quarter, but the fall is brief and price recovers on heavy volume. That reaction may reflect a less-bad outcome than feared, short covering, or other flows. It does not prove the problem is solved. Separate the business question from the chart question.
A social post claims a takeover; the share jumps, then gives back most of the move. Treat the claim as unverified until a reliable, accountable source confirms it. Thin liquidity and fast orders can magnify a move in either direction.
ABC reports roughly what investors expected. The price barely moves. “No surprise” is still information about expectations, but it is not automatically a buy or sell signal. The existing trend, valuation, and your own time horizon still matter.
What chart analysis can and cannot do
Technical analysis can help describe trend, volatility, trading range, volume, and places where buyers or sellers previously became active. It can help a trader define an entry condition or a level that would challenge a trade thesis. It cannot reliably tell you why every move happened, whether a rumour is true, or what a company is worth.
After major news, historical levels may still matter, but the context has changed. A gap can skip over a level; volatility can expand; a previously orderly pattern can become noisy. A stop order may trigger at one price and fill at another. A chart level is an observation, not a force field.
What news analysis can and cannot do
Fundamental analysis asks how verified information could change the business: sales, margins, debt, cash flow, competition, management, and future expectations. For results, compare the actual figures and guidance with what was expected, not only with last year’s numbers. For a rumour, first ask whether it comes from a credible source and whether the company or exchange has confirmed it.
News analysis also has limits. Early reports may be incomplete, headlines may omit important details, and public information may already be reflected in the price. A correct view of the business does not specify when the price will respond. A chart can show the response, but cannot certify that your interpretation of the news is correct.
News-and-chart combinations: what to examine
Use this as a set of questions, not a signal service. “Positive” and “negative” describe the information as you understand it; price confirmation describes observed behavior, not proof that your interpretation is right.
Check whether the business impact and valuation still make sense. If a planned entry remains valid, use your pre-set risk and avoid chasing a gap just because the chart is green.
Compare the result with expectations, guidance, margins, and prior price run-up. Waiting for verified details or a clearer setup can be more disciplined than buying automatically.
Ask whether the original reason for holding is invalidated. If your plan defined a reduction or exit condition, review it rather than widening a stop solely to avoid realizing a loss.
Do not treat the spike as confirmation that the rumour is true. Verify the source, consider liquidity and reversal risk, and be willing to miss the move rather than trade on a claim you cannot check.
A practical decision framework
Use news and charts as different inputs rather than forcing them to compete for a single winner. Before placing an order, work through these questions:
- Verify the information. Is it an official filing, company statement, credible report, or unconfirmed social-media claim? What is known, and what is still speculation?
- Measure the surprise. What had the market expected? Compare results and guidance with those expectations where reliable estimates are available. “Positive” and “negative” are not enough on their own.
- Identify what may have changed. Does the information affect long-term business prospects, near-term earnings, financial risk, or only short-term sentiment? Be explicit about the time horizon.
- Read the reaction, not just the candle. Note the gap, volume, volatility, and whether price holds or rejects important areas over a timeframe that fits your plan. One bar cannot explain the whole story.
- Choose an action that fits your rules. Depending on your research and plan, that could mean wait for confirmation, enter only at a defined risk, keep an existing position, reduce exposure, or exit if the thesis is invalidated. “Do nothing yet” is also a decision.
- Size for uncertainty. News-driven gaps can make the assumed stop loss unreliable. Stress-test a worse exit price and check the position against your capital, total portfolio risk, and ability to absorb a loss.
When signals conflict, slow the decision down
Imagine the news appears positive but the share falls sharply. Instead of asking only “Should I buy the dip?”, list plausible explanations: expectations were higher; guidance disappointed; the price had run ahead of results; investors are selling to take profits; or the move is temporary. Then identify which facts could distinguish those explanations and what would invalidate your own view.
If you cannot verify the catalyst, estimate the risk, or explain why the price reaction conflicts with the headline, chasing the move is not analysis. Waiting for more information, reducing a position to a level you can tolerate, or passing on the trade may be more consistent with a disciplined process than making a rapid guess.
News can be wrong or incomplete. Charts can fail. Combining them can improve context, but it cannot remove uncertainty or guarantee the next move.
Conclusion: use both, but ask different questions
News does not always move first, and a chart does not always lead. Rumours and expectations can move price before an official announcement; after publication, the chart shows how orders react to the information available. Sometimes the price move is immediate, sometimes delayed, and sometimes the expected event produces little reaction at all.
Use verified news and fundamental analysis to ask, “What may have changed about the business or its outlook?” Use chart analysis to ask, “How is price behaving, where might my idea be wrong, and what execution risks exist?” Then use a written plan and position size to decide whether to buy, sell, hold, wait, or pass. No article can make that personal decision for you.
Estimate position size for a defined risk scenario Stress-test a hypothetical gap exit